Mostrando entradas con la etiqueta json. Mostrar todas las entradas

lunes, 1 de octubre de 2018

Level up logs and ELK - Logstash Grok, JSON Filter and JSON Input performance comparision

Articles index:

  1. Introduction (Everyone)
  2. JSON as logs format (Everyone)
  3. Logging best practices with Logback (Targetting Java DEVs)
  4. Logging cutting-edge practices (Targetting Java DEVs) 
  5. Contract first log generator (Targetting Java DEVs)
  6. ElasticSearch VRR Estimation Strategy (Targetting OPS)
  7. VRR Java + Logback configuration (Targetting OPS)
  8. VRR FileBeat configuration (Targetting OPS)
  9. VRR Logstash configuration and Index templates (Targetting OPS)
  10. VRR Curator configuration (Targetting OPS)
  11. Logstash Grok, JSON Filter and JSON Input performance comparison (Targetting OPS)


Logstash Grok, JSON Filter and JSON Input performance comparison


As part of the VRR strategy altogether, I've performed a little experiment to compare performance for different configurations.

I keep using the FileBeat -> Logstash -> Elasticsearch <- Kibana, this time everything updated to 6.4.1 using Docker.

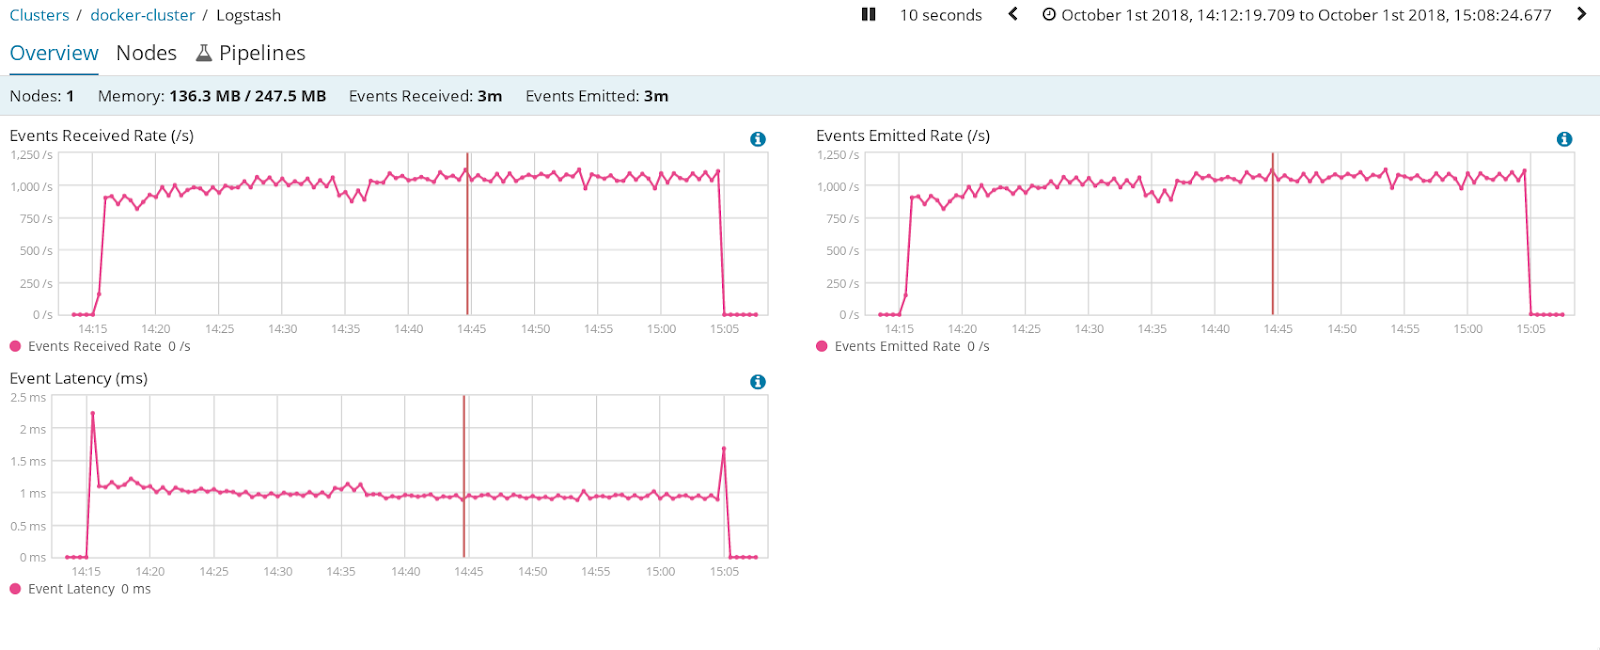
Experiment consist on letting FileBeat read a file containing 3 million entries, generated in JSON (923000198 bytes) and plain text (492000055 bytes) by a modified version of VRR.java. Logstash will be reading from the beats plugin and will use the information within to redirect these lines to the most suitable index (1m to critical, 1m to important, 1m to low).

Monitoring is enabled from Kibana and Logstash so all the information is collected and stored in ElasticSearch itself.

Given everything is running in the same box, under the same concurrent load (none), same CPU, memory and disk profile, and same cluster configuration (one ElasticSearch in total), this result is not a representative result for throughput in any case, however, it should be a valid experiment for performance comparison.


 Logstash + Grok Filter + KV Filter

This configuration takes input from Beats input, uses Grok to take some fields apart (message, timestamp, rid, loglevel..), then applies KV to find key-value pairs in the text, finally uses the information from key-value to choose index.

input {
  beats {
    port => 5044
  }
}

filter {
    grok {
        match => [ "message" , "%{TIME:@timestamp} %{UUID:rid} \[%{WORD:thread}\] 
%{LOGLEVEL:loglevel}\s+%{WORD:classname} - %{GREEDYDATA:message}" ]
        overwrite => ["message"]
}

kv {

}
}

output {
        if [importance] == "CRIT" { 
            elasticsearch { 
                hosts => "elasticsearch:9200"
                index => "vrr-%{[fields][service]}-crit-%{+YYYY-MM-dd}" 
                template => "templates/template-max.json" 
                template_overwrite => true
                template_name => "vrr-max"
            }
        } else if [importance] == "IMP" { 
            elasticsearch { 
                hosts => "elasticsearch:9200"
                index => "vrr-%{[fields][service]}-imp-%{+YYYY-MM-dd}" 
                template => "templates/template-mid.json" 
                template_overwrite => true
                template_name => "vrr-mid"
            }
        } else { 
            elasticsearch { 
                hosts => "elasticsearch:9200"
                index => "vrr-%{[fields][service]}-low-%{+YYYY-MM-dd}" 
                template => "templates/template-min.json" 
                template_overwrite => true
                template_name => "vrr-min"
            }
        }
        
  
}


Results:

  • 1 million entries per each VRR index, OK
  • Around 600 events per seconds went through Logstash, processing each one in approximately 1500 micro seconds (just above really)
  • CPU averages between 20% and 25%


Logstash + JSON Filter

In this case we are using a JSON log file with the same amount of information, and will be extracted using JSON filter plugin in Logstash. After that, sending to the right index based on the extracted information.

input {
  beats {
    port => 5044
  }
}

filter {
    if [fields][logschema] == "vrr" {
        json {
            source => "message"
        }
    }
}

output {
     if [fields][logschema] == "vrr" { 
        if [importance] == "CRIT" { 
            elasticsearch { 
                hosts => "elasticsearch:9200"
                index => "vrr-%{[fields][service]}-crit-%{+YYYY-MM-dd}" 
                template => "templates/template-max.json" 
                template_overwrite => true
                template_name => "vrr-max"
            }
        } else if [importance] == "IMP" { 
            elasticsearch { 
                hosts => "elasticsearch:9200"
                index => "vrr-%{[fields][service]}-imp-%{+YYYY-MM-dd}" 
                template => "templates/template-mid.json" 
                template_overwrite => true
                template_name => "vrr-mid"
            }
        } else { 
            elasticsearch { 
                hosts => "elasticsearch:9200"
                index => "vrr-%{[fields][service]}-low-%{+YYYY-MM-dd}" 
                template => "templates/template-min.json" 
                template_overwrite => true
                template_name => "vrr-min"
            }
        }
        
    } else { 
        elasticsearch {
            hosts => "elasticsearch:9200"
            index => "logstash-classic-%{[fields][service]}-%{+YYYY-MM-dd-HH}" 
        }
    }
}


Results

  • 1 million entries per each VRR index, OK
  • Around 875 events per seconds went through Logstash, processing each one in approximately 1150 micro seconds.
  • CPU averages between 15% and 20%


Logstash + JSON Input

Only difference with previous test is that JSON is applied at entry level instead of filter level, for my own sake, I really wanted to know what's the difference.


input {
  beats {
    port => 5044
    codec => json
  }
}

output {
     if [fields][logschema] == "vrr" { 
        if [importance] == "CRIT" { 
            elasticsearch { 
                hosts => "elasticsearch:9200"
                index => "vrr-%{[fields][service]}-crit-%{+YYYY-MM-dd}" 
                template => "templates/template-max.json" 
                template_overwrite => true
                template_name => "vrr-max"
            }
        } else if [importance] == "IMP" { 
            elasticsearch { 
                hosts => "elasticsearch:9200"
                index => "vrr-%{[fields][service]}-imp-%{+YYYY-MM-dd}" 
                template => "templates/template-mid.json" 
                template_overwrite => true
                template_name => "vrr-mid"
            }
        } else { 
            elasticsearch { 
                hosts => "elasticsearch:9200"
                index => "vrr-%{[fields][service]}-low-%{+YYYY-MM-dd}" 
                template => "templates/template-min.json" 
                template_overwrite => true
                template_name => "vrr-min"
            }
        }
        
    } else { 
        elasticsearch {
            hosts => "elasticsearch:9200"
            index => "logstash-classic-%{[fields][service]}-%{+YYYY-MM-dd-HH}" 
        }
    }
}


Results:

  • 1 million entries per each VRR index, OK
  • Around 1000 events per seconds went through Logstash, processing each one in approximately 1000 micro seconds.
  • CPU averages around 15%


Conclusions:

Using Grok with KV is the slowest option.
Using JSON as input is the fastest option, but reduces the flexibility of having several formats in the same input. This can be mitigated with different pipelines and ports.
Using JSON as filter provides the same flexibility than Grok without the big performance penalty. It is slower than JSON as input though.


miércoles, 12 de septiembre de 2018

Level up logs and ELK - ElasticSearch Replication Factor and Retention - VRR Estimation Strategy

Articles index:

  1. Introduction (Everyone)
  2. JSON as logs format (Everyone)
  3. Logging best practices with Logback (Targetting Java DEVs)
  4. Logging cutting-edge practices (Targetting Java DEVs) 
  5. Contract first log generator (Targetting Java DEVs)
  6. ElasticSearch VRR Estimation Strategy (Targetting OPS)
  7. VRR Java + Logback configuration (Targetting OPS)
  8. VRR FileBeat configuration (Targetting OPS)
  9. VRR Logstash configuration and Index templates (Targetting OPS)
  10. VRR Curator configuration (Targetting OPS)
  11. Logstash Grok, JSON Filter and JSON Input performance comparison (Targetting OPS)

ElasticSearch VRR Estimation Strategy


Estimating how much storage is needed by ElasticSearch to store your logs depends on three variables mostly.

  • Replication factor: ElasticSearch can allocate copies of your logs in distributed nodes so it becomes fault tolerant. If a node dies, other can continue with reading and writing info for that index/shard.
  • Retention: ElasticSearch is unable to choose by itself for how long data will be kept. However other tools like Curator can help to define this variable. Curator will be our option in this series of articles.
  • Volume: Logs to be stored, it's an obvious variable.

We are not going to consider other variables, but feel free to dig in anytime with this document from the horse's mouth The true story behind Elasticsearch storage requirements.

Monolithic estimation strategy

In order to estimate the storage needed by an application across all ElasticSearch nodes, you'll need to make the following simple calculation:

replication factor * retention (days) * volume (per day) = total storage needed.

One of my clients had 4TB of logs per day (averaged), let's make some numbers:
4TB/day * 365 days retention requiered * 3 copies = 4380TB storage required.
Someone suffered a heart attack in that meeting...

Variable-retention-replication (VRR) estimation strategy

Previous calculation has an implicit assumption, all information from the same file share the same importance, therefore same retention and replication factor. As a software developer and log generator, I know that's radically false.

The only way to solve this problem is to admit that not all the information in an application log file is equally important. If we consider three categories, "low importance", "important", "critical", we would need all project managers to define their logs' importance as a matrix of "importance percentage", "retention" and "replication" almost line by line (VRR matrix).

VRR (Variable Replication and Retention) Matrix for example application:

Being generous, most of the logs from the example application are useless after one or two weeks, they are only useful to investigate problems if they arose. This is purely debug information. In order to be conservative in calculations, we'll say it's 89% and it is required for two weeks retention with no replication (1 copy in total).

Around 10% of example application logs could be considered important, they are user tracking/activity, application events and synthetic information about errors. From this information we are creating most of the dashboards as well, and for that reason we need replication too (replication helps with search performance). 10% of the logs are required for three months retention and single-replication (2 copies in total).

Around 1% of example application logs are critical, information like user audit, log-in activity and product hiring / purchases events. 1% of the logs are required for 53 weeks retention and double-replication (3 copies in total, it's important not to lose this information).

Example application VRR Matrix:
Importance Percentage Retention Replication
Debug 89% 14 days 1 copy
Important 10% 90 days 2 copies
Critical 1% 371 days 3 copies

As an academical example, let's apply this matrix to the 4TB we mentioned before, knowing there would be a VRR matrix per application and those 4TB belonged to dozens of them.
The hypothetical result would be:

4TB * (0.89 * 14 * 1 + 0.10 * 90 * 2 + 0.01 * 371 * 3 ) = 166TB

By these numbers, we just need 166TB to cover a year round of logs, that's 3% of the originally estimated 4380TB we calculated with the monolithic strategy.

Maybe comparing with an entire year of 3 copies of everything it's a bit too much, let's compare with other strategies:
  • 1 Month 3 copies monolithic strategy -> 372TB, more than double
  • 1 Year 1 copy monolithic stragegy -> 1484TB, 9 times more (this is almost the 90% promised in the clickbait!)
You need to go as low as 2 weeks 3 copies to find a comparable size -> 168TB. Now, what do you prefer?

a) 1 Year 3 Copies for critical info, 3 months 2 copies for important, 2 weeks single copy for the rest or..

b) 3 copies 2 weeks for everything.

How VRR translates to configuration?

Replication is an index property, this is telling us we need a different index per "importance". We need to tell ElasticSearch what's the replication policy when we create the index (it could be told after creation, but this is just more comfortable).
See VRR Logstash configuration

Retention is a curator policy that we will apply per-index.
See VRR Curator configuration

Logstash will create the indices in ElasticSearch depending on the importance using index-templates. We need to put different "importance" logs in different indices. Logstash can do that as long as these logs are "tagged" in a way Logstash understands (e.g. JSON fields in the logs).
See VRR Logstash configuration and VRR FileBeat configuration

Logs in JSON format can be easily tagged without extra OPS time, untagged logs will be assimilated as the lowest importance so it's developer responsibility to tag them.
See VRR Java + Logback configuration


Steps to implement VRR Strategy

  1. Developers need to tag all lines of logs with the "importance" on them. As explained before, if they used JSON, it would be easier for everyone. Untagged logs will be considered of the lowest importance.
  2. Project managers and developers need to define VRR Matrix to estimate log storage requirements for OPS.
  3. For all application implementing VRR, OPS need to use one single special entry in Logstash to create importance-dependent indices in ElasticSearch using VRR matrix information. Index name will contain service name, date and importance so curator can distinguish them. They also need to change Index Templates accordingly.
  4. Curator configuration to be aware of VRR matrix to remove information as soon as allowed.
OPS will tell you to please have a common VRR policy for all applications, it's easier to manage. It's not a crazy request and you's still  be in a much better place than you used to be anyway.


Next: 7 - VRR Java + Logback configuration


Level up logs and ELK - VRR Curator configuration

Articles index:

  1. Introduction (Everyone)
  2. JSON as logs format (Everyone)
  3. Logging best practices with Logback (Targetting Java DEVs)
  4. Logging cutting-edge practices (Targetting Java DEVs) 
  5. Contract first log generator (Targetting Java DEVs)
  6. ElasticSearch VRR Estimation Strategy (Targetting OPS)
  7. VRR Java + Logback configuration (Targetting OPS)
  8. VRR FileBeat configuration (Targetting OPS)
  9. VRR Logstash configuration and Index templates (Targetting OPS)
  10. VRR Curator configuration (Targetting OPS)
  11. Logstash Grok, JSON Filter and JSON Input performance comparison (Targetting OPS)

VRR Curator configuration


Curator configuration

Last piece of the puzzle, Curator will take care of deleting information from ElasticSearch once it has expired according to our policies.

There are two ways of deleting information from ElasticSearch using its API
  1. By deleting documents through a query that uses timestamp -> SLOW, deleting a document requires modifying indices and caches.
  2. By deleting indices as a whole -> FAST. But you cannot choose what to delete inside an index, it all goes down.
The best way of deleting indices but only old information is to create an index per day (or other granularity) and let curator understand the day format from the index name.
Then curator can delete the oldest indices and keep the newest at the same time.

Finally, Curator is not a daemon, it needs to be executed, normally once a day is enough (really as often as your smaller granularity).

Configuration example:

File available here

---
actions:
  1: <- Sets an order of execution
    action: delete_indices <- action
    description: >-
      Delete indices older than 3 days (based on index name), for vrr-*-crit-
      prefixed indices. Application/Service name is irrelevant, but this only 
      applies to "crit" indices. Ignore the error if the filter does not result in an
      actionable list of indices (ignore_empty_list) and exit cleanly.
    options:
      ignore_empty_list: True
      timeout_override:
      continue_if_exception: False
      disable_action: False <- otherwise it wouldn't execute
    filters:
    - filtertype: pattern
      kind: regex
      value: vrr-.*-crit- <- Applies to all VRR critical indices, no matter the application. 
this is only valid if you get an agreement on retention being the same for all application for
the same importance. 
      exclude:
    - filtertype: age <- Second filter, we are filtering by age
      source: name
      direction: older
      timestring: '%Y-%m-%d' <- date format in the index (set in logstash!)
      unit: days
      unit_count: 371 <- delete if older than 371 days ("days" defined in unit, just above)
      exclude:
  2:
    action: delete_indices
    description: >-
      Delete indices older than 2 days (based on index name), for vrr-*-imp-
      prefixed indices. Application/Service name is irrelevant, but this only 
      applies to "imp" indices. Ignore the error if the filter does not result in an
      actionable list of indices (ignore_empty_list) and exit cleanly.
    options:
      ignore_empty_list: True
      timeout_override:
      continue_if_exception: False
      disable_action: False
    filters:
    - filtertype: pattern
      kind: regex
      value: vrr-.*-imp- <- Applies to all VRR important indices
      exclude:
    - filtertype: age
      source: name
      direction: older
      timestring: '%Y-%m-%d'
      unit: days
      unit_count: 90 <- delete if older than 90 days
      exclude:
  3:
    action: delete_indices
    description: >-
      Delete indices older than 1 days (based on index name), for vrr-*-low-
      prefixed indices. Application/Service name is irrelevant, but this only 
      applies to "low" indices. Ignore the error if the filter does not result in an
      actionable list of indices (ignore_empty_list) and exit cleanly.
    options:
      ignore_empty_list: True
      timeout_override:
      continue_if_exception: False
      disable_action: False
    filters:
    - filtertype: pattern
      kind: regex
      value: vrr-.*-low- <- Applies to all VRR low indices
      exclude:
    - filtertype: age
      source: name
      direction: older
      timestring: '%Y-%m-%d'
      unit: days
      unit_count: 14 <- delete if older than 14 days
      exclude:


Next: 11 - Logstash Grok, JSON Filter and JSON Input performance comparison

Level up logs and ELK - VRR FileBeat configuration

Articles index:

  1. Introduction (Everyone)
  2. JSON as logs format (Everyone)
  3. Logging best practices with Logback (Targetting Java DEVs)
  4. Logging cutting-edge practices (Targetting Java DEVs) 
  5. Contract first log generator (Targetting Java DEVs)
  6. ElasticSearch VRR Estimation Strategy (Targetting OPS)
  7. VRR Java + Logback configuration (Targetting OPS)
  8. VRR FileBeat configuration (Targetting OPS)
  9. VRR Logstash configuration and Index templates (Targetting OPS)
  10. VRR Curator configuration (Targetting OPS)
  11. Logstash Grok, JSON Filter and JSON Input performance comparison (Targetting OPS)

VRR FileBeat configuration


Filebeat doesn't need much configuration for JSON log files, just our typical agreement between parties:
  • DEVs agree to 
    • use JSON for logs, 
    • VRR as log retention strategy, 
    • "imp" JSON field for VRR "importance" fields with values LOW, IMP, CRIT
    • no "imp" field means LOW importance
  • OPS agree to
    • take this file and use retention and replication depending on those fields
    • add "service" in filebeat for application name
    • add "environment" in filebeat where applicable
    • add "logschema":"vrr" to distinguish a common approach for logs.

As contract is mostly the same for all applications, Filebeat configuration is very reusable, one entry per application and box.

This file, in a working example, can be found here.

- type: log
  enabled: true <- important ;)
  paths:
    - /path/to/logFile.json 
  encoding: utf-8
  fields:
    logschema: vrr <- this value will be reused in Logstash configuration
    service: leveluplogging <- application / service name
    environment: production <- optional, very.


Next: 9 - VRR Logstash configuration and Index templates

Level up logs and ELK - VRR Logstash configuration

Articles index:

  1. Introduction (Everyone)
  2. JSON as logs format (Everyone)
  3. Logging best practices with Logback (Targetting Java DEVs)
  4. Logging cutting-edge practices (Targetting Java DEVs) 
  5. Contract first log generator (Targetting Java DEVs)
  6. ElasticSearch VRR Estimation Strategy (Targetting OPS)
  7. VRR Java + Logback configuration (Targetting OPS)
  8. VRR FileBeat configuration (Targetting OPS)
  9. VRR Logstash configuration and Index templates (Targetting OPS)
  10. VRR Curator configuration (Targetting OPS)
  11. Logstash Grok, JSON Filter and JSON Input performance comparison (Targetting OPS)

VRR Logstash configuration and Index templates

Logstash configuration from example can be found here.

input {
  beats {
    port => 5044
    codec => json
  }
}

output {
     if [fields][logschema] == "vrr" { //for ALL VRR applications
        if [importance] == "CRIT" { //for ALL CRITICAL LINES
            elasticsearch { //send to SERVICE-LOGSCHEMA-IMP-DATE index (vrr-loggingup-crit-2018-09-10) with template template.max
                hosts => "localhost:9200"
                index => "vrr-%{[fields][service]}-crit-%{+YYYY-MM-dd}" //ONE INDEX PER APPLICATION AND DAY AND IMPORTANCE
                template => "/path/to/templates/template-max.json" //USING THIS TEMPLATE, NEXT CHAPTER!
                template_overwrite => true
                template_name => "vrr-max"
            }
        } else if [importance] == "IMP" { //for ALL CRITICAL LINES
            elasticsearch { //send to SERVICE-LOGSCHEMA-IMP-DATE index (vrr-loggingup-imp-2018-09-10) with template template.mid
                hosts => "localhost:9200"
                index => "vrr-%{[fields][service]}-imp-%{+YYYY-MM-dd}" //ONE INDEX PER APPLICATION AND DAY AND IMPORTANCE
                template => "/path/to/templates/template-mid.json" //USING THIS TEMPLATE, NEXT CHAPTER!
                template_overwrite => true
                template_name => "vrr-mid"
            }
        } else { //FOR BOTH "LOW" AND NO-EXPLICIT TAGGING
            elasticsearch { //send to SERVICE-LOGSCHEMA-IMP-DATE index (vrr-loggingup-low-2018-09-10) with template template.min
                hosts => "localhost:9200"
                index => "vrr-%{[fields][service]}-low-%{+YYYY-MM-dd}" //ONE INDEX PER APPLICATION AND DAY AND IMPORTANCE
                template => "/path/to/templates/template-min.json" //USING THIS TEMPLATE, NEXT CHAPTER!
                template_overwrite => true
                template_name => "vrr-min"
            }
        }
        
    } else { //OTHER NON-VRR APPLICATIONS
        elasticsearch {
            hosts => "localhost:9200"
            index => "logstash-classic-%{[fields][service]}-%{+YYYY-MM-dd-HH}" //STILL ONE SEPARATE INDEX PER APPLICATION AND DAY
        }
    }
}

Template template-max.json (here)

{
  "index_patterns": ["vrr-*-crit-*"], //FOR ALL INDICES THAT MATCH THIS EXPRESSION 
  "order" : 1, <- Overrides order 0 settings (default values like number of shards or mappings)
  "settings": {
    "number_of_replicas": 2 //WE WANT 2 EXTRA COPIES + MASTER
  }
}

Template template-mid.json (here)

{
  "index_patterns": ["vrr-*-imp-*"], //FOR ALL INDICES THAT MATCH THIS EXPRESSION 
  "order" : 1, <- Overrides order 0 settings (default values like number of shards or mappings)
  "settings": {
    "number_of_replicas": 1 //WE WANT AN EXTRA COPY + MASTER
  }
}

Template template-min.json (here)

{
  "index_patterns": ["vrr-*-low-*"], //FOR ALL INDICES THAT MATCH THIS EXPRESSION 
  "order" : 1, <- Overrides order 0 settings (default values like number of shards or mappings)
  "settings": {
    "number_of_replicas": 0 //WE DON'T WANT EXTRA COPIES, JUST MASTER
  }
}


Next: 10 - VRR Curator configuration


Level up logs and ELK - VRR Java + Logback configuration

Articles index:

  1. Introduction (Everyone)
  2. JSON as logs format (Everyone)
  3. Logging best practices with Logback (Targetting Java DEVs)
  4. Logging cutting-edge practices (Targetting Java DEVs) 
  5. Contract first log generator (Targetting Java DEVs)
  6. ElasticSearch VRR Estimation Strategy (Targetting OPS)
  7. VRR Java + Logback configuration (Targetting OPS)
  8. VRR FileBeat configuration (Targetting OPS)
  9. VRR Logstash configuration and Index templates (Targetting OPS)
  10. VRR Curator configuration (Targetting OPS)
  11. Logstash Grok, JSON Filter and JSON Input performance comparison (Targetting OPS)

VRR Java + Logback configuration


Applying VRR to Java Logback application.


Example application defining importance per line using Structured Arguments

Product Owner, OPS and Developers have agreed to use tag/flag/mark "importance" with possible values "LOW" for lowest importance, "IMP" for mid-importance and "CRIT" for critical importance.

Example code without comments available here.


public class VRR {

    private static final String IMPORTANCE = "importance";
    private static final StructuredArgument LOW = kv(IMPORTANCE, "LOW"); //CREATING OBJECTS
    private static final StructuredArgument IMP = kv(IMPORTANCE, "IMP"); //TO REUSE AND
    private static final StructuredArgument CRIT = kv(IMPORTANCE, "CRIT"); //AVOID REWRITING

    private static final Logger logger = LoggerFactory.getLogger(VRR.class);

    public static void main(String[] args) {
        MDC.put("rid", UUID.randomUUID().toString()); //SAME MDC USAGE AVAILABLE
        try {
            long startTime = currentTimeMillis();
            someFunction();
            logger.info("important message, useful to so some metrics {} {}",
                    kv("elapsedmillis", currentTimeMillis() - startTime),
                    IMP); //IMPORTANT MESSAGE
        } catch (Exception e) {
            logger.error("This is a low importance message as it won't have value after few weeks", 
                          e); //THIS IS A LOW IMPORTANCE MESSAGE AS IT'S NOT TAGGED
        }
    }

    static void someFunction() throws Exception {
        logger.info("low importance message, helps to trace errors, begin someFunction {} {} {}",
                kv("user","anavarro"),
                kv("action","file-create"),
                LOW); //LOW IMPORTANCE TAGGED MESSAGE, SLIGHTLY REDUNDANT, SAME THAN UNTAGGED

        Thread.sleep(500L); //some work

        logger.info("critical message, audit trail for user action {} {} {}",
                kv("user","anavarro"),
                kv("action","file-create"),
                CRIT); //CRITICAL MESSAGE
    }
}

Previously mentioned logback.xml configuration

<configuration>
    <appender class="ch.qos.logback.core.rolling.RollingFileAppender" name="stash">
        <file>logFile.json</file>
        <rollingpolicy class="ch.qos.logback.core.rolling.TimeBasedRollingPolicy">
            <filenamepattern>file.log.%d{yyyy-MM-dd}</filenamepattern>
            <maxhistory>30</maxhistory>
        </rollingpolicy>
        <encoder class="net.logstash.logback.encoder.LoggingEventCompositeJsonEncoder">
            <providers>
                <timestamp>
                <threadname>
                <mdc>
                <loggername>
                <message>
                <loglevel>
                <arguments>
                <stacktrace>
                <stackhash>
            </stackhash></stacktrace></arguments></loglevel></message></loggername></mdc></threadname></timestamp></providers>
        </encoder>
    </appender>

    <appender class="ch.qos.logback.core.ConsoleAppender" name="STDOUT">
        <encoder>
            <pattern>%d{HH:mm:ss.SSS} [%thread] %-5level %logger{36} - %msg%n</pattern>
        </encoder>
    </appender>

    <root level="all">
        <appender-ref ref="stash">
        <appender-ref ref="STDOUT">
    </appender-ref></appender-ref></root>
</configuration>

Code and configuration together, we get a result as JSON files as follow:


{"@timestamp":"2018-09-11T00:05:11.746+02:00","thread_name":"main",
 "rid":"7fac3070-0d7e-40a6-a3e8-246ec95e86e7","logger_name":"VRR", 
"message":"low importance message, helps to trace errors, begin someFunction 
user=anavarro action=file-create importance=LOW","level":"INFO","user":"anavarro", 
"action":"file-create","importance":"LOW"}

{"@timestamp":"2018-09-11T00:05:12.271+02:00","thread_name":"main",
 "rid":"7fac3070-0d7e-40a6-a3e8-246ec95e86e7","logger_name":"VRR",
 "message":"critical message, audit trail for user action 
user=anavarro action=file-create importance=CRIT","level":"INFO","user":"anavarro", 
"action":"file-create","importance":"CRIT"}

{"@timestamp":"2018-09-11T00:05:12.274+02:00","thread_name":"main", 
"rid":"7fac3070-0d7e-40a6-a3e8-246ec95e86e7","logger_name":"VRR",
 "message":"important message, useful to so some metrics elapsedmillis=528 importance=IMP", 
"level":"INFO","elapsedmillis":528,"importance":"IMP"}
 

Next: 8 - VRR FileBeat configuration


jueves, 6 de septiembre de 2018

Level up logs and ELK - JSON logs

Articles index:

  1. Introduction (Everyone)
  2. JSON as logs format (Everyone)
  3. Logging best practices with Logback (Targetting Java DEVs)
  4. Logging cutting-edge practices (Targetting Java DEVs) 
  5. Contract first log generator (Targetting Java DEVs)
  6. ElasticSearch VRR Estimation Strategy (Targetting OPS)
  7. VRR Java + Logback configuration (Targetting OPS)
  8. VRR FileBeat configuration (Targetting OPS)
  9. VRR Logstash configuration and Index templates (Targetting OPS)
  10. VRR Curator configuration (Targetting OPS)
  11. Logstash Grok, JSON Filter and JSON Input performance comparison (Targetting OPS)

JSON as logs format


JSON Logs

JSON is not the only solution, but it's one of them, and the one I am advocating for until I find something better.

Based on my personal experience across almost a dozen companies, Logs lifecycle looks like this a lot:

Bad log lifecycle:
  1. Logs are created as plain text, using natural language, unstructured.
  2. Lines are batched together if they belong to an exception stacktrace, otherwise treated as individual messages (regex work).
  3. Parsed using Grok, message and timestamp are extracted from parts of the parsing (more regex).
  4. If logs are structured, or unstructured fixed-format, some useful information can be extracted by using Grok (e.g. Apache or Nginx logs, they are always the same, easy).
  5. OPS team see how Grok consumes all CPU it can find and reject to add more regex to the expression.
  6. Developers want to get information from logs to index and plot, they ask OPS to please add some lines to Grok. Three OPS suicide and other two quit the company. Developers finally get what they want.
  7. DEV team changes the logs without telling OPS, so previously useful information stops flowing in, dashboards are now empty and nobody cares.
It doesn't really matter if your company doesn't match all previous bullet points. As long as you are using Grok, you will struggle to squeeze 50+ different regex in a single or series of Grok Regex expressions in order to extract all the information you want, and, as long as your log writing team is not your Logstash maintaining team, your Grok configuration will get outdated for good and it will happen soon.

However, if your application produced JSON, that's it, all fields go through Logstash and end up in ElasticSearch without OPS intervention at all.

Alternative steps using JSON + Logback + Logstash + ElasticSearch:
  1. Logs are created in JSON, it's developer responsibility to choose what extra metrics needs to be extracted from the code itself. Even exceptions with stacktrace are single liners JSON documents in the log file.
  2. Log files are taken by FileBeat and sent to Logstash line by line. This configuration is written once and won't change much after that.
  3. Logstash takes these lines and send it to its index in ElasticSearch without any other processing, again, write once (for all applications, not even once per application).
  4. ElasticSearch take this information, index per application, day and priority, it will keep the extra fields that developers put in the logs in first place.
  5. When developers want to expose more fields, they don't need to bother anyone, if it's in the logs, they will be in ElasticSearch. (Maybe asking for a reindexing in ES every now and then, not too much).

Using JSON as your log format is, by all means, part of the solution I am presenting here.

I haven't yet explored other topologies, like using Fluentd instead of Logstash, or FileBeat sending to ElasticSearch directly, yet to explore.


Next: 3 - Logging best practices with Logback


miércoles, 5 de septiembre de 2018

Level up logs and ELK - Introduction

Articles index:

    1. Introduction (Everyone)
    2. JSON as logs format (Everyone)
    3. Logging best practices with Logback (Targetting Java DEVs)
    4. Logging cutting-edge practices (Targetting Java DEVs) 
    5. Contract first log generator (Targetting Java DEVs)
    6. ElasticSearch VRR Estimation Strategy (Targetting OPS)
    7. VRR Java + Logback configuration (Targetting OPS)
    8. VRR FileBeat configuration (Targetting OPS)
    9. VRR Logstash configuration and Index templates (Targetting OPS)
    10. VRR Curator configuration (Targetting OPS)
    11. Logstash Grok, JSON Filter and JSON Input performance comparison (Targetting OPS)


      Introduction


      Why this? Why now?

      This is the result of many years as a developer knowing that there was something called "logs":
      A log is something super important that you cannot change because someone reads them, you cannot read them either because you don't have ssh access to the boxes they are generated in. Write them, but not too much, disk may fill.
      Then learned how to write them, then suffered how to read them (grep) until I knew there was a superexpensive tool that could collect, sort, query and present them for you.
      Then I love them, always thought of them like the ultimate audit tool but still too many colleagues preferred to use database for that sort of functionality.

      I got better at logging like it was a nice story happening in my application, learned also how to correlate logs across multiple services, but I barely managed to create good dashboards.It happened that Splunk was too expensive to buy, and ElasticSearch too expensive to maintain. Infamous years without managing logs happened again.

      Finally I got a job that involved architecture-level monitoring decisions and got the opportunity to develop a logging strategy for ElasticSearch (Splunk and other managed platforms didn't require that much hard thinking as they were providing the know-how and setup time). The strategy I will be developing in the next few articles came as a solution to many common restrictions in all companies I've been around the last decade.

      It is a long story, will try to make it concise, bear with me and, if you belong to that huge 95% of companies that uses ElasticSearch as a supergrep, you'll raise your game.

      Objectives of this series of articles:

      1. Save up to 90% disk space based on VRR (Variable Replication factor and Retention) estimations by playing with replication, retention and custom classification.
          • Differentiate important from redundant information and apply different policies to them.
      2. Log useful information for once, that you will be able to filter, query, plot and alert on.
        • We are covering parameters, structured arguments, and how to avoid grok to parse them.
      3. Save tons of OPS time by using the right tools to empower DEVs to be responsible of their logs.
        •  Let's avoid bothering our heroes with each change in a log line. Minimizing OPS time is paramount.

      Some assumptions:

      • All my examples will orbit around Java applications using SLF4J log framework, backed by Logback.
      • Logs are dumped to files, read by FileBeat, sent to Logstash.
      • Logstash receives the log lines and send them to ElasticSearch after some processing.
      • Kibana as ElasticSearch UI.

      Even if your stack is not 100% identical, I am sure you can apply some bits from here.


      Next:  2 - JSON as logs format