Articles index:
- Introduction (Everyone)
- JSON as logs format (Everyone)
- Logging best practices with Logback (Targetting Java DEVs)
- Logging cutting-edge practices (Targetting Java DEVs)
- Contract first log generator (Targetting Java DEVs)
- ElasticSearch VRR Estimation Strategy (Targetting OPS)
- VRR Java + Logback configuration (Targetting OPS)
- VRR FileBeat configuration (Targetting OPS)
- VRR Logstash configuration and Index templates (Targetting OPS)
- VRR Curator configuration (Targetting OPS)
- Logstash Grok, JSON Filter and JSON Input performance comparison (Targetting OPS)
Logstash Grok, JSON Filter and JSON Input performance comparison
As part of the VRR strategy altogether, I've performed a little experiment to compare performance for different configurations.
I keep using the FileBeat -> Logstash -> Elasticsearch <- Kibana, this time everything updated to 6.4.1 using Docker.
Experiment consist on letting FileBeat read a file containing 3 million entries, generated in JSON (923000198 bytes) and plain text (492000055 bytes) by a modified version of VRR.java. Logstash will be reading from the beats plugin and will use the information within to redirect these lines to the most suitable index (1m to critical, 1m to important, 1m to low).
Monitoring is enabled from Kibana and Logstash so all the information is collected and stored in ElasticSearch itself.
Given everything is running in the same box, under the same concurrent load (none), same CPU, memory and disk profile, and same cluster configuration (one ElasticSearch in total), this result is not a representative result for throughput in any case, however, it should be a valid experiment for performance comparison.
Logstash + Grok Filter + KV Filter
This configuration takes input from Beats input, uses Grok to take some fields apart (message, timestamp, rid, loglevel..), then applies KV to find key-value pairs in the text, finally uses the information from key-value to choose index.input {
beats {
port => 5044
}
}
filter {
grok {
match => [ "message" , "%{TIME:@timestamp} %{UUID:rid} \[%{WORD:thread}\]
%{LOGLEVEL:loglevel}\s+%{WORD:classname} - %{GREEDYDATA:message}" ]
        overwrite => ["message"]
}

kv {

}
}

output {
        if [importance] == "CRIT" {
            elasticsearch {
                hosts => "elasticsearch:9200"
                index => "vrr-%{[fields][service]}-crit-%{+YYYY-MM-dd}"
                template => "templates/template-max.json"
                template_overwrite => true
                template_name => "vrr-max"
            }
        } else if [importance] == "IMP" {
            elasticsearch {
                hosts => "elasticsearch:9200"
                index => "vrr-%{[fields][service]}-imp-%{+YYYY-MM-dd}"
                template => "templates/template-mid.json"
                template_overwrite => true
                template_name => "vrr-mid"
            }
        } else {
            elasticsearch {
                hosts => "elasticsearch:9200"
                index => "vrr-%{[fields][service]}-low-%{+YYYY-MM-dd}"
                template => "templates/template-min.json"
                template_overwrite => true
                template_name => "vrr-min"
            }
        }


}
Results:
- 1 million entries per each VRR index, OK
- Around 600 events per seconds went through Logstash, processing each one in approximately 1500 micro seconds (just above really)
- CPU averages between 20% and 25%


Logstash + JSON Filter
In this case we are using a JSON log file with the same amount of information, and will be extracted using JSON filter plugin in Logstash. After that, sending to the right index based on the extracted information.input {
beats {
port => 5044
}
}
filter {
if [fields][logschema] == "vrr" {
json {
source => "message"
}
}
}
output {
if [fields][logschema] == "vrr" {
if [importance] == "CRIT" {
elasticsearch {
hosts => "elasticsearch:9200"
index => "vrr-%{[fields][service]}-crit-%{+YYYY-MM-dd}"
template => "templates/template-max.json"
template_overwrite => true
template_name => "vrr-max"
}
} else if [importance] == "IMP" {
elasticsearch {
hosts => "elasticsearch:9200"
index => "vrr-%{[fields][service]}-imp-%{+YYYY-MM-dd}"
template => "templates/template-mid.json"
template_overwrite => true
template_name => "vrr-mid"
}
} else {
elasticsearch {
hosts => "elasticsearch:9200"
index => "vrr-%{[fields][service]}-low-%{+YYYY-MM-dd}"
template => "templates/template-min.json"
template_overwrite => true
template_name => "vrr-min"
}
}
} else {
elasticsearch {
hosts => "elasticsearch:9200"
index => "logstash-classic-%{[fields][service]}-%{+YYYY-MM-dd-HH}"
}
}
}Results
- 1 million entries per each VRR index, OK
- Around 875 events per seconds went through Logstash, processing each one in approximately 1150 micro seconds.
- CPU averages between 15% and 20%


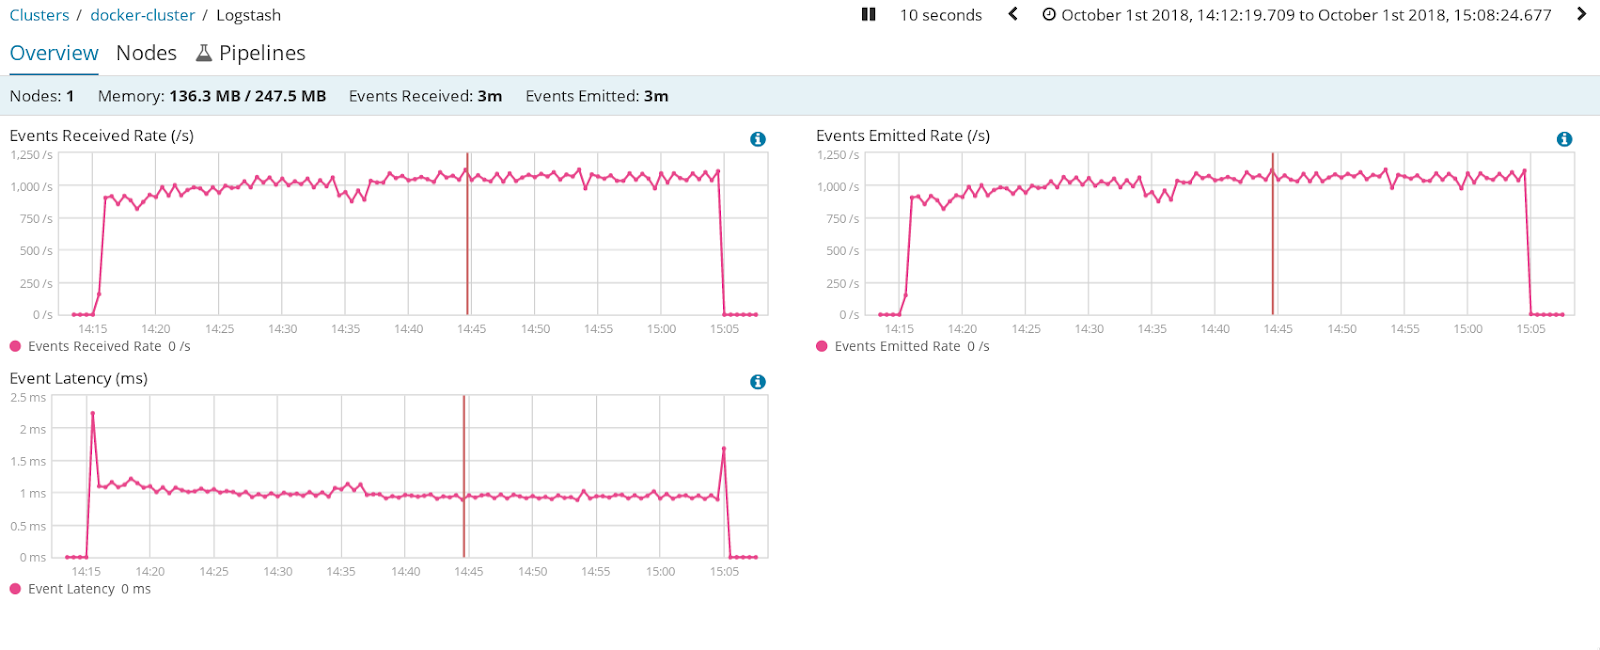
Logstash + JSON Input
Only difference with previous test is that JSON is applied at entry level instead of filter level, for my own sake, I really wanted to know what's the difference.
input {
  beats {
    port => 5044
    codec => json
  }
}

output {
     if [fields][logschema] == "vrr" {
        if [importance] == "CRIT" {
            elasticsearch {
                hosts => "elasticsearch:9200"
                index => "vrr-%{[fields][service]}-crit-%{+YYYY-MM-dd}"
                template => "templates/template-max.json"
                template_overwrite => true
                template_name => "vrr-max"
            }
        } else if [importance] == "IMP" {
            elasticsearch {
                hosts => "elasticsearch:9200"
                index => "vrr-%{[fields][service]}-imp-%{+YYYY-MM-dd}"
                template => "templates/template-mid.json"
                template_overwrite => true
                template_name => "vrr-mid"
            }
        } else {
            elasticsearch {
                hosts => "elasticsearch:9200"
                index => "vrr-%{[fields][service]}-low-%{+YYYY-MM-dd}"
                template => "templates/template-min.json"
                template_overwrite => true
                template_name => "vrr-min"
            }
        }

    } else {
        elasticsearch {
            hosts => "elasticsearch:9200"
            index => "logstash-classic-%{[fields][service]}-%{+YYYY-MM-dd-HH}"
        }
    }
}
Results:
- 1 million entries per each VRR index, OK
- Around 1000 events per seconds went through Logstash, processing each one in approximately 1000 micro seconds.
- CPU averages around 15%


Conclusions:
Using Grok with KV is the slowest option.Using JSON as input is the fastest option, but reduces the flexibility of having several formats in the same input. This can be mitigated with different pipelines and ports.
Using JSON as filter provides the same flexibility than Grok without the big performance penalty. It is slower than JSON as input though.